Spatial Coverage (web-GIS)

Q. What is Spatial Coverage?
A. A web-based Geographical Information System (GIS) is a online tool to represent spatial information/coverage over the internet.
Q. What value addition it can offer to my business?
A. It offers a combination of web-interactive maps, demographic data and business data. The analysis happens due to spatial reasoning. Spatial Reasoning results in map-data analysis
Q. What is the step foward?
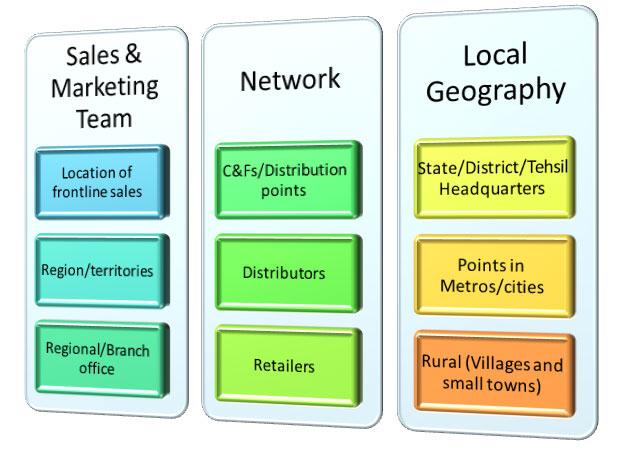
A. First step towards acquiring spatial sensing/reasoning to your business is to map your operations. It can be easily done over administrative boundaries, pincodes, sales-territories, etc.
BENEFITS::Coverage Products::Extensible & Adaptability
Contact us by Phone/Email and we will quickly setup a live working demo
Spatial Dashboards
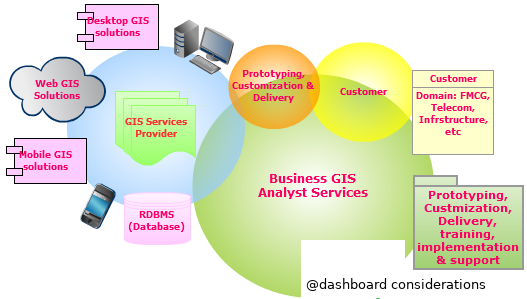
Implementation of a customized Enterprise wide GIS project poses numerous challenges. GIS services providing companies find it difficult to create effective dashboards and to take care of product prototyping, delivery and training of personnel.
The result is the mismatch between customer expectations and the actual Analysis that a dashboard can provide.
Mapline Informatics's intuitive and user friendly dashboards bring the power of map to your fingertips. Data query, view, charting and map-analysis can never be this easy. .
TOP-10 reasons, Our Customers love our MAP Dashboards:
1. Context is key for map-visualization
2. Spatial data speaks for itself, less it is, better it would be.
3. Legends are for map-geeks, our maps show their data explicitly.
4. We use map as a filter for drill-down data.
5. On an efficient Dashboard, mouse click is better than key-board click.

6. Color is the key for uniform and optmized dashboard viewing.
7. Only data gives sense but spatial data gives common sense that can be built into a story.
8. Shapes (point, line and polygon) make it easier to get sense out of a complex dashboard.
9. Filtered and queried map-data generates sensiblle charts and graphics.
10. Pan and Zoom is the double edge sword in map-data analytics.
Contact us by Phone/Email and we will quickly setup a live working demo